Azure Service Bus Explorer alternatives
Published July 21, 2026
The best Azure Service Bus Explorer alternative depends on the job. Use QueueExplorer for a cross-platform message workbench; use the Azure portal for an occasional peek, send, receive, or purge on an Azure-hosted namespace; use the community Service Bus Explorer when you want a free Windows desktop application; use Azure CLI, PowerShell, or infrastructure as code for topology; use the Azure SDKs for repeatable message workflows; and use Azure Monitor for metrics, logs, and alerts.
No single tool is best at message repair, schema deployment, automation, and production monitoring. Most teams need at least one message-level tool plus a separate monitoring and deployment workflow.
First, which Azure Service Bus Explorer do you mean?
Two different tools use almost the same name:
- Service Bus Explorer in the Azure portal is Microsoft's browser-based data-operations feature inside an Azure Service Bus entity.
- Service Bus Explorer from the
paolosalvatori/ServiceBusExplorerGitHub repository is a separate, community-owned, open-source Windows desktop application.
Microsoft's own portal Explorer documentation explicitly distinguishes the two. When comparing alternatives, check which one a feature list or tutorial is describing.
Azure Service Bus Explorer alternatives compared
| Alternative | Best for | Platform | Main tradeoff |
|---|---|---|---|
| QueueExplorer | Browsing, filtering, editing, moving, saving, and replaying messages, including sessions and special states | Windows, macOS, Linux | Commercial desktop application; not a historical monitoring service |
| Azure portal Service Bus Explorer | Occasional peek, send, receive, settlement, dead-letter, and purge operations | Web browser | No emulator or sessions; bounded browser workflow and large-message limitations |
| Community Service Bus Explorer | Free desktop administration, message testing, dead-letter work, and definition export | Windows 10 or later | Manual message loading, text-only body view, no definition import, and no extracted custom columns |
| Azure CLI, PowerShell, Bicep, or Terraform | Repeatable namespace and entity configuration | Cross-platform, depending on tool | Control-plane tools are not visual message browsers |
| Current Azure Service Bus SDKs | Custom runbooks, transactions, scheduled jobs, and application-integrated workflows | .NET, Java, Python, JavaScript, Go | You must build and maintain the interface, validation, retries, and audit trail |
| Azure Monitor and Log Analytics | Metrics, logs, dashboards, alerting, and historical diagnosis | Azure portal, APIs, Grafana, other clients | Observability only; it does not browse or repair message bodies |
1. QueueExplorer: a cross-platform Azure Service Bus GUI
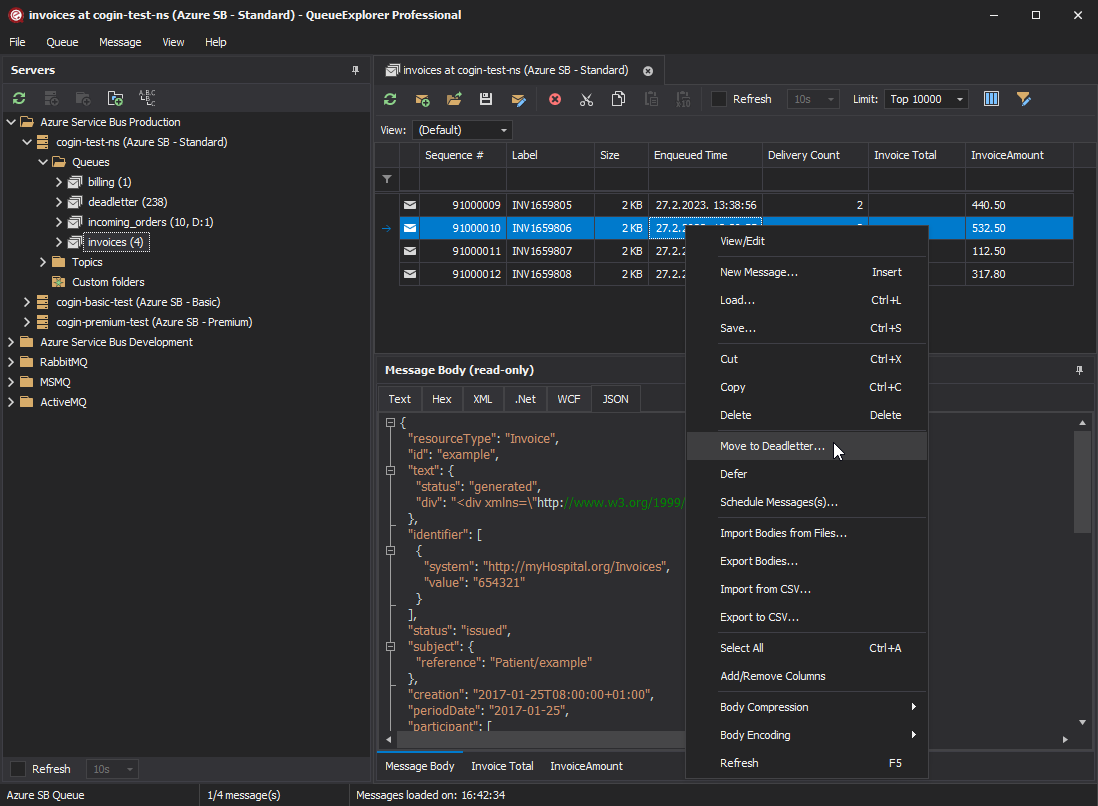
QueueExplorer is the most direct alternative when the problem is working with messages rather than only checking counts or configuring resources. It presents namespaces, queues, topics, subscriptions, subqueues, sessions, and messages in one desktop interface.
- Sign in with Microsoft Entra ID and Azure RBAC, use a SAS connection string for a namespace or single queue or topic, or connect directly to the Azure Service Bus Emulator.
- Display messages immediately when a queue or topic subscription is selected, then continue loading progressively.
- Choose message properties and application properties as columns, then sort or filter the loaded results.
- Inspect JSON, XML, text, WCF, and binary bodies without writing diagnostic code.
- Extract business values from JSON, XML, or text into filterable columns in the Professional edition.
- Browse dead-letter, transfer, transfer dead-letter, deferred, and scheduled message states.
- List Azure Service Bus sessions, inspect their messages, and view or edit session state.
- Create, edit, copy, move, delete, defer, schedule, save, and load messages.
- Export and import queue, topic, and subscription definitions, or copy them between namespaces.
The QueueExplorer connection guide explains Entra ID roles, tenant selection, SAS scopes, emulator ports, and the permission difference between enumerating topology and accessing messages.
Free trial for Windows, macOS, and Linux
Where QueueExplorer fits
Use it in development to inspect exactly what a producer sent, create test messages, and reproduce a consumer failure. During an incident, use it to locate a malformed or dead-lettered message, save a copy, correct the problem, and replay or move the selected messages.
QueueExplorer is also useful when the portal lacks the required message state or workflow, such as browsing deferred and scheduled messages or managing session messages and state. See the practical guide to browsing Azure Service Bus messages.
It does not replace Azure Monitor alerts, durable log storage, or a version-controlled deployment pipeline. Use those alongside it for production operations.
2. Azure portal Service Bus Explorer: convenient built-in data operations
The portal Explorer requires no separate installation and works with Azure role-based access control. It is a good option for an occasional operation when the browser can reach an Azure-hosted Service Bus namespace.
The portal Service Bus Explorer does not work with the Azure Service Bus Emulator. Use QueueExplorer or another client that can connect directly to the emulator host and ports for local development.
The current portal feature can:
- peek queue, subscription, and dead-letter messages without removing them;
- start a peek from a chosen Sequence Number;
- send messages to a queue or topic;
- receive with Peek-Lock or destructive Receive-and-Delete;
- complete, abandon, defer, or dead-letter a locked delivery; and
- purge eligible messages from an entity.
The standard Peek workflow displays up to 100 messages. Microsoft also documents that the Explorer does not support sessions or management operations. Entity creation and configuration still happen elsewhere in the portal, while session-aware data operations require another tool or an SDK client.
Large messages can time out or be loaded differently: the portal does not retrieve large bodies by default when the entity allows messages over 1 MB, and a received body over 1 MB can be truncated in the display. Use a client with configurable timeouts when full large-message handling is required.
Network placement also matters. The data operation originates from the browser's environment. For a namespace available only through a private endpoint, the browser must run on a host that can reach that virtual network.
3. Community Service Bus Explorer: free Windows desktop tool
The community Service Bus Explorer is an MIT-licensed Windows application. Its documented features include a live message-count dashboard, queue and subscription tree filtering, namespace definition export, send/receive/peek operations, dead-letter management, and support for related Azure messaging services.
It also supports interactive Microsoft Entra ID sign-in for Azure Service Bus in the public Azure cloud, with some authentication and sovereign-cloud limitations documented by the project. The stated software requirements are Windows 10 or later and .NET Framework 4.6.2.
This is the strongest free desktop choice when Windows is already the operator platform and community support is acceptable. The project states that it has no dedicated developers and is maintained through volunteer effort. It also notes an ongoing migration from legacy Azure messaging SDKs, so evaluate the current release, supported authentication mode, and required workflows before making it part of a production runbook.
QueueExplorer compared with the community desktop Service Bus Explorer
Both applications can connect to Azure Service Bus and perform common message operations, but their everyday browsing and migration workflows differ:
- Message display: QueueExplorer starts displaying messages as soon as you browse a queue or subscription. The community Explorer requires you to load messages manually each time.
- Body viewers: QueueExplorer provides dedicated JSON, XML, text, WCF, and hexadecimal viewers. The community Explorer provides a text view without dedicated JSON or XML viewers.
- Custom columns: QueueExplorer Professional can extract values from JSON, XML, or text with JSON expressions, XPath, or regular expressions and expose them as sortable, filterable columns. The community Explorer does not provide extracted custom columns.
- Schema migration: QueueExplorer can export and import definitions or copy them between namespaces. The community Explorer can export definitions but does not import them, so it cannot complete the same schema-migration workflow.
4. Azure CLI, PowerShell, and infrastructure as code: topology automation
The Azure CLI az servicebus commands
and Azure PowerShell manage namespaces, queues, topics, subscriptions, filters, authorization rules, and disaster
recovery configuration through the Azure Resource Manager control plane. Bicep, ARM templates, and Terraform
make that schema versioned and repeatable.
az servicebus queue list \
  --resource-group "orders-rg" \
  --namespace-name "orders-prod"

az servicebus topic subscription rule list \
  --resource-group "orders-rg" \
  --namespace-name "orders-prod" \
  --topic-name "orders" \
  --subscription-name "billing"
These tools are alternatives to clicking through topology screens, not to a message workbench. The native CLI control-plane commands do not enumerate and display stored message bodies. Use QueueExplorer, the portal Explorer, the community application, or an Azure Service Bus SDK for data-plane message operations.
Prefer infrastructure as code for stable production schema. Review a diff, deploy it to a test namespace, and keep message migration separate from topology deployment. Queue definitions do not contain queued messages.
5. Azure Service Bus SDKs: build a precise operational workflow
Use a current Azure Service Bus SDK when an operation must be repeatable, scheduled, audited, integrated into an application, or constrained by business-specific validation. Microsoft provides current libraries for .NET, Java, Python, JavaScript, and Go.
An SDK workflow can:
- peek repeatedly from a Sequence Number and process messages in controlled batches;
- receive with Peek-Lock, renew locks, and settle each outcome explicitly;
- retrieve deferred messages by Sequence Number;
- accept and process sessions;
- schedule and cancel messages;
- use transactions for supported operations within one namespace; and
- apply organization-specific authorization, approval, logging, and replay limits.
The tradeoff is ownership. Your team must implement pagination, timeouts, retry behavior, idempotency, message deserialization, destructive-action guards, private-network access, and a usable interface.
Do not start new tooling on the legacy WindowsAzure.ServiceBus,
Microsoft.Azure.ServiceBus, or com.microsoft.azure.servicebus libraries. Microsoft is
retiring their support, along with SBMP protocol support, on September 30, 2026. Use the current Azure SDK and
AMQP-based clients.
6. Azure Monitor and Log Analytics: the production monitoring alternative
Azure Monitor for Service Bus collects platform metrics and can route resource logs through diagnostic settings. Metrics Explorer, Log Analytics, workbooks, dashboards, alerts, and Grafana integrations help teams detect growing backlogs, dead-letter activity, throttling, connection problems, and abnormal traffic over time.
Azure Monitor answers “when did the system become unhealthy?” and “which entity is affected?” It does not show the body of an arbitrary queued message or provide a repair-and-replay workflow. Open QueueExplorer or another message tool after an alert identifies the entity.
Platform metrics are collected automatically, but resource logs must be routed to a destination before they can be retained and queried. Log Analytics, storage, data transfer, and partner integrations can add cost, so define retention and collection deliberately.
7. Commercial SaaS operations platforms: centralized team workflows
A commercial cloud operations platform can be appropriate when multiple teams need shared dashboards, dead-letter alerts, approval workflows, scheduled automation, and an audit trail without installing desktop software. These products solve a broader integration-operations problem than a simple message browser.
Evaluate how the platform reaches private endpoints, where credentials and message bodies are processed, which Azure clouds and authentication methods it supports, how destructive actions are approved, and how pricing scales with namespaces, messages, users, and retained telemetry. A SaaS control plane is not automatically a better fit for sensitive payloads or isolated networks.
Which Azure Service Bus Explorer alternative should you choose?
- Inspect, filter, edit, move, save, or replay messages on Windows, macOS, or Linux: QueueExplorer.
- Perform an occasional no-install operation on an Azure-hosted namespace: Azure portal Service Bus Explorer.
- Use a free Windows desktop application: community Service Bus Explorer.
- Deploy queues, topics, subscriptions, and rules repeatedly: Azure CLI, PowerShell, Bicep, or Terraform.
- Build a controlled message runbook or application feature: a current Azure Service Bus SDK.
- Detect production issues and retain operational history: Azure Monitor and Log Analytics.
- Coordinate operations across a larger integration estate: evaluate a managed SaaS platform.
A practical production setup often uses Azure Monitor for detection, infrastructure as code for topology, QueueExplorer for controlled message investigation, and SDK-based runbooks for approved repeatable repairs.
Security considerations for every alternative
- QueueExplorer supports Microsoft Entra ID login and role-based authorization at namespace or individual entity scope.
- When SAS is required, create a narrowly scoped policy instead of sharing
RootManageSharedAccessKey. - Use Azure Service Bus Data Receiver for read and receive tasks, Data Sender for sending, and Data Owner only when broad data access is genuinely required.
- Separate read-only investigation from message settlement, purge, replay, and topology changes.
- Keep the operator host inside the required private network and do not weaken namespace firewall rules merely to make a tool convenient.
- Treat message bodies and exports as production data that may contain credentials, personal data, or commercial records.
- Audit destructive operations and preserve messages before deleting, moving, editing, or replaying them.
Frequently asked questions
What is the best Azure Service Bus Explorer alternative?
QueueExplorer is the most direct cross-platform alternative for interactive message inspection and operations. The portal is sufficient for occasional simple data operations, while the community Explorer is a strong free Windows option. Automation and monitoring need different tools.
Are the Azure portal Explorer and the open-source Service Bus Explorer the same tool?
No. The portal Explorer is a Microsoft feature inside Azure portal. The standalone Windows application is a community-owned open-source project hosted on GitHub.
Is there an Azure Service Bus Explorer for macOS or Linux?
QueueExplorer runs on Windows, macOS, and Linux. Azure portal is browser-based, and the CLI, PowerShell, and current Azure SDKs also provide cross-platform options. The community Service Bus Explorer documents Windows 10 or later as its supported platform.
Can Azure CLI browse Azure Service Bus message bodies?
The native az servicebus commands manage Azure Resource Manager resources and configuration; they
do not provide a visual or general-purpose body browser. Use a message tool or an SDK data-plane client.
Can the portal Service Bus Explorer browse sessions?
No. Microsoft's current portal documentation lists sessions as unsupported. QueueExplorer can list sessions, browse their messages, and inspect or edit session state.
Can the portal Service Bus Explorer connect to the Azure Service Bus Emulator?
No. The portal Explorer works with Azure-hosted Service Bus namespaces and cannot connect to a local emulator. QueueExplorer can connect directly to the emulator by host name and optional AMQP and administration ports.
Does Azure Monitor show message contents?
No. It stores service metrics and configured operational logs, not an index of arbitrary queued message bodies. Use it to locate an unhealthy entity, then use a message browser for payload-level investigation.
For a practical walkthrough, continue with how to browse and inspect Azure Service Bus messages, or compare the safety implications of deleting specific messages and moving selected messages.
QueueExplorer: a better way to inspect and manage Azure Service Bus
See what is happening in Azure Service Bus and resolve message problems without writing one-off tools. Browse queues and topic subscriptions, inspect message contents, and manage your Azure Service Bus environment from one desktop application. Try it free on Windows, macOS, or Linux.