RabbitMQ Management UI alternatives
Published July 21, 2026
The best RabbitMQ Management UI alternative depends on the job. Use
QueueExplorer when you need a visual message workbench; use
rabbitmqadmin or the HTTP API for repeatable administration; use
rabbitmqctl and rabbitmq-diagnostics for node operations; and use Prometheus with
Grafana for long-term production monitoring.
These tools are complementary. Replacing one browser screen with another will not solve message repair, automation, node diagnostics, and historical monitoring equally well.
Do you need to replace the RabbitMQ Management UI?
Not necessarily. RabbitMQ's management plugin combines a browser UI, an HTTP API, and the
rabbitmqadmin command-line tool. Its UI is convenient for checking queues, exchanges, bindings,
connections, users, and recent metrics. It remains a useful general-purpose administration surface.
Its limitations become visible when a workflow needs a searchable message list, editing or moving selected messages, reproducible automation, node-level diagnostics, alerts, or metrics retained for days and months. RabbitMQ itself describes the Management UI as a short-term monitoring option and recommends external monitoring for production. See the official management plugin documentation.
RabbitMQ Management UI alternatives compared
| Alternative | Best for | Main tradeoff |
|---|---|---|
| QueueExplorer | Browsing queue and stream messages, plus queue message inspection and operations | Interactive desktop tool, not a historical metrics platform |
rabbitmqadmin v2 |
Terminal-based topology administration, health checks, and scripts | Uses the management HTTP API and is not a message workbench |
rabbitmqctl and rabbitmq-diagnostics |
Node administration, health checks, cluster status, and troubleshooting | Command-line access and RabbitMQ node authentication are required |
| Management HTTP API | Custom dashboards, integrations, and repeatable remote administration | You must build the workflow, validation, and user experience |
| Prometheus and Grafana | Historical metrics, dashboards, alerting, and capacity analysis | Monitoring only; it does not edit topology or queue messages |
| Definitions and infrastructure as code | Versioned, reviewable, and repeatable topology deployment | Not suitable for live message inspection or incident repair |
1. QueueExplorer: a GUI for message-level work
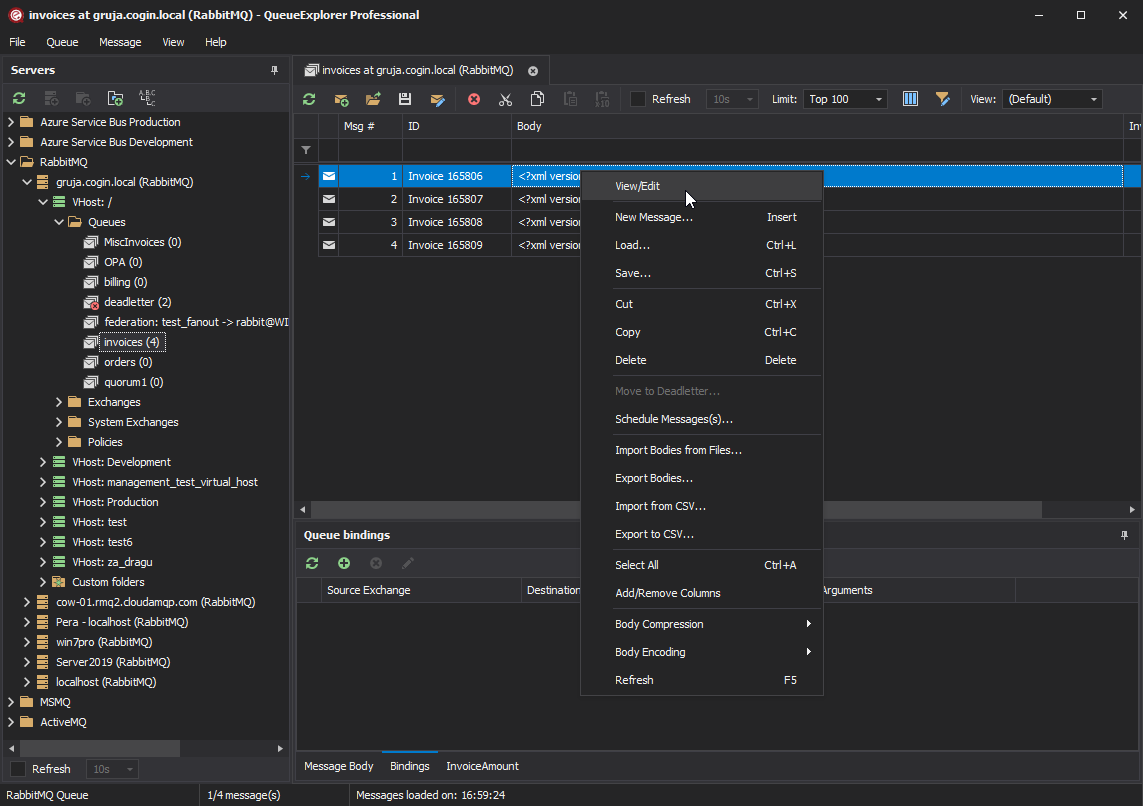
QueueExplorer is the closest alternative when the missing capability is working with the messages themselves. It connects to RabbitMQ from Windows, macOS, or Linux and presents queues, streams, and messages in an explorer-style desktop interface.
- Progressively load messages and choose which properties and headers appear as columns.
- Sort and filter loaded messages by body, routing key, message ID, properties, or headers.
- Preview JSON, XML, text, hexadecimal, WCF, Gzip, and Deflate content.
- Edit or create messages and publish them to a queue or exchange.
- Copy, move, delete, save, load, and drag selected messages between queues.
- Analyze dead-letter headers and replay failed messages after correcting the cause.
- Browse RabbitMQ streams page by page, or jump to their beginning, end, or a specific offset.
Stream operations follow RabbitMQ's append-only model: QueueExplorer can write new stream messages but cannot remove individual existing entries. The Cut, Move, Delete, and replay operations above apply to queues. See the RabbitMQ stream browsing example.
Free trial for Windows, macOS, and Linux
Where QueueExplorer fits
Use it during development to verify what producers send and reproduce consumer failures. During an incident, use it to find a malformed or dead-lettered message, preserve a copy, correct it, and replay it. It also helps with targeted maintenance such as moving selected messages to another queue.
QueueExplorer does not replace alerting, long-term metric storage, or node-local diagnostics. It works best alongside the official production monitoring and administration tools.
2. rabbitmqadmin v2: management from a terminal
rabbitmqadmin v2 is RabbitMQ's command-line client for the management HTTP API. It can list,
declare, and delete topology; inspect nodes and metrics; run health checks; manage definitions; close
connections; and work with federation and shovels. It is a good choice for an operator who prefers a terminal
or needs commands that can be recorded in a runbook.
rabbitmqadmin show overview
rabbitmqadmin --vhost "orders" queues list
rabbitmqadmin --vhost "orders" queues show --name "orders.ready"
The tool is useful interactively and offers non-interactive output for scripts. It is not a replacement for
all core CLI commands, and because it uses the HTTP API, it depends on management API access. Use the syntax
that matches your installed version; current commands are documented in the
rabbitmqadmin v2 guide.
3. rabbitmqctl and rabbitmq-diagnostics: node operations
The core CLI tools reach operational areas that the HTTP API intentionally does not expose.
rabbitmqctl handles service and broker administration, while rabbitmq-diagnostics
focuses on health checks, runtime state, and troubleshooting.
rabbitmq-diagnostics status
rabbitmq-diagnostics check_running
rabbitmqctl list_queues name messages consumers
These tools are the better alternative during startup failures, cluster incidents, alarm investigation, and automated node checks. They require appropriate access to the RabbitMQ node and use a different authentication model from the browser UI. See RabbitMQ's command-line tools guide.
4. RabbitMQ HTTP API: build the exact workflow you need
The management plugin exposes queue, exchange, binding, connection, channel, user, permission, policy, and metric data through HTTP endpoints. Use it when a deployment pipeline, internal support portal, scheduled job, or configuration audit needs machine-readable access.
An API integration is repeatable and can enforce organization-specific validation, but it also makes your application responsible for authentication, pagination, retries, version compatibility, destructive-action guards, and audit logging. The API is not a shortcut to atomic message editing or movement; those operations still require AMQP consume-and-publish semantics. Consult the current HTTP API reference.
5. Prometheus and Grafana: the production monitoring alternative
RabbitMQ recommends Prometheus and Grafana for long-term production monitoring. The
rabbitmq_prometheus plugin exposes metrics for Prometheus, and RabbitMQ maintains Grafana
dashboards for cluster overview, Erlang runtime behavior, inter-node communication, Raft, and other areas.
This combination supports durable history, alerting, capacity planning, and comparisons across nodes and clusters. It is a monitoring replacement for the Management UI's recent charts, not an administration or message-management replacement. See the official Prometheus and Grafana guide.
6. Definitions and infrastructure as code: replace manual topology changes
If the problem is repeated clicking to create queues, exchanges, bindings, users, permissions, or policies,
move those definitions into a reviewed deployment workflow. RabbitMQ definitions can be exported and imported,
and rabbitmqadmin v2 can transform definitions for common migration tasks.
Definitions describe broker schema, not queued messages. Our guide to migrating RabbitMQ schema covers the available methods and complete cutover sequence. Treat production imports like code deployments: review the diff, test it in a non-production virtual host, back up the existing definitions, and restrict destructive changes. See RabbitMQ's schema definition guide.
Which alternative should you choose?
- Inspect, search, edit, move, or replay messages: QueueExplorer.
- Perform occasional visual broker administration: keep the built-in Management UI.
- Run repeatable remote administration commands:
rabbitmqadminv2. - Diagnose or operate RabbitMQ nodes:
rabbitmq-diagnosticsandrabbitmqctl. - Build an internal integration: the management HTTP API plus an AMQP client when messages must be consumed or published.
- Monitor production over time: Prometheus, Grafana, and an alerting system.
- Make topology repeatable: versioned definitions or infrastructure as code.
A mature production setup often uses four surfaces: Grafana for detection, CLI/API runbooks for broker operations, QueueExplorer for controlled message investigation, and the Management UI for convenient ad hoc checks.
Security considerations
- Do not expose the management listener or monitoring endpoints directly to the public internet.
- Use TLS, network controls, and least-privilege accounts for both humans and automation.
- Separate monitoring credentials from accounts that can configure topology or consume messages.
- Use read-only access during investigation until a message or topology change is required.
- Record scripted and destructive operations, and test recovery procedures outside production.
Frequently asked questions
What is the best RabbitMQ Management UI alternative?
For message inspection and operations, QueueExplorer is the most direct visual alternative. For monitoring, use Prometheus and Grafana. For automation or node administration, use the HTTP and command-line tools. No single alternative is best at all three jobs.
Is QueueExplorer a complete replacement for the Management UI?
QueueExplorer goes much further for viewing and changing messages, but the built-in UI remains convenient for broker-level administration and recent metrics. Many teams use both, with Prometheus/Grafana for production monitoring.
Which alternatives are free?
RabbitMQ's core CLI tools, rabbitmqadmin, HTTP API, Prometheus plugin, and published Grafana
dashboards are available as part of the open-source RabbitMQ ecosystem. QueueExplorer is a commercial desktop
application with a free trial.
Can these tools inspect message bodies?
QueueExplorer is designed for browsing queue bodies and headers across a practical message list, and for paging through streams from a selected offset. The Management UI and HTTP API can fetch bounded batches for troubleshooting, while CLI and monitoring tools focus primarily on broker state and metrics.
For a closer two-tool comparison, see RabbitMQ management console versus QueueExplorer, or read the broader RabbitMQ GUI guide.
QueueExplorer: a better way to inspect and manage RabbitMQ
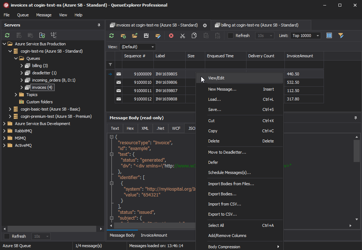
See what is happening in RabbitMQ and resolve message problems without writing one-off tools. Browse queues and streams, inspect message contents, and manage your RabbitMQ environment from one desktop application. Try it free on Windows, macOS, or Linux.